
This map shows where weather is most comfortable across the United States during November, based on Perfect Weather Index scores averaged across recent years.
Scores combine temperature, sunshine, humidity, and wind to highlight regions that consistently offer the most pleasant outdoor conditions for the month.
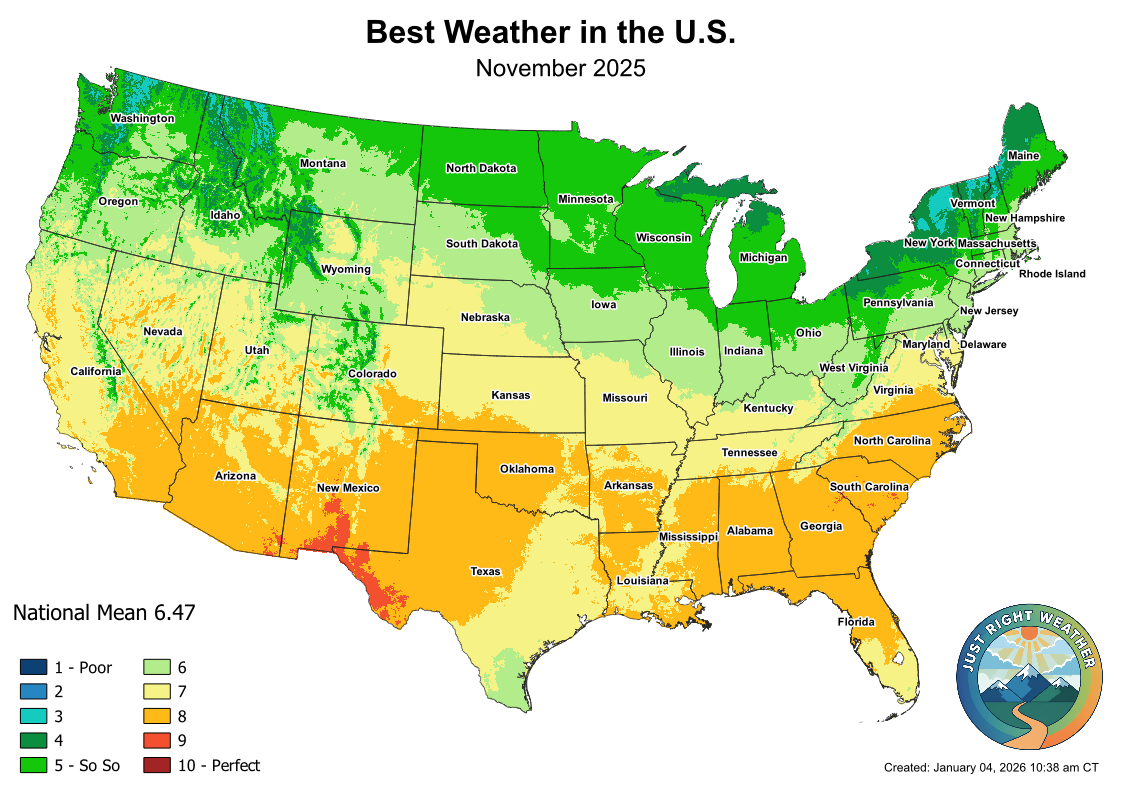
As colder air masses push south from Canada, the most comfortable weather consolidates in the southern United States. The desert Southwest and Rio Grande Valley benefit from warm, dry conditions with fewer temperature extremes — while much of the Southeast sees a noticeable drop in humidity compared to summer and early fall.
Southern New Mexico — particularly the White Sands region — consistently ranks at the top in November. Mild daytime temperatures, very low humidity, abundant sunshine, and minimal storm activity make this one of the most reliable locations for outdoor comfort late in the fall.
Far West Texas, especially around El Paso, performs similarly well. Dry air, frequent sunshine, and moderate temperatures combine to produce highly favorable conditions compared to most of the country.
A broad swath of the southern U.S. also performs well — from Oklahoma through Arkansas, Tennessee, and into the Carolinas — as cooler temperatures replace summer heat while humidity continues to decline.
November is a good month to visit desert national parks. The Grand Canyon and Zion offer uncrowded conditions with comfortable temperatures before winter cold sets in at higher elevations.
(Based on statewide average Perfect Weather Index scores.)
November rewards travelers who head south. The desert Southwest and Rio Grande Valley offer the most reliable comfort, with the southern Plains and Southeast close behind. Northern destinations — particularly the Northeast and Pacific Northwest — become far less reliable as winter conditions take hold.
For a detailed look at how November 2025 specifically played out, see the November 2025 weather recap.
Data Note:
This analysis is based on National Weather Service forecast data and represents modeled conditions, not verified observations. Results reflect relative comfort patterns for November and may vary from year to year.