
Best Weather by State
in the U.S.
A statewide look at where weather most often feels just right, based on Perfect Weather Index scores derived from National Weather Service forecast data.
Which States Have the Best Overall Weather?
Weather varies widely across the United States, influenced by geography, season, elevation, humidity, storm tracks, and regional weather patterns. This page compares states using statewide Perfect Weather Index scores that account for temperature, sunshine, humidity, precipitation, and wind.
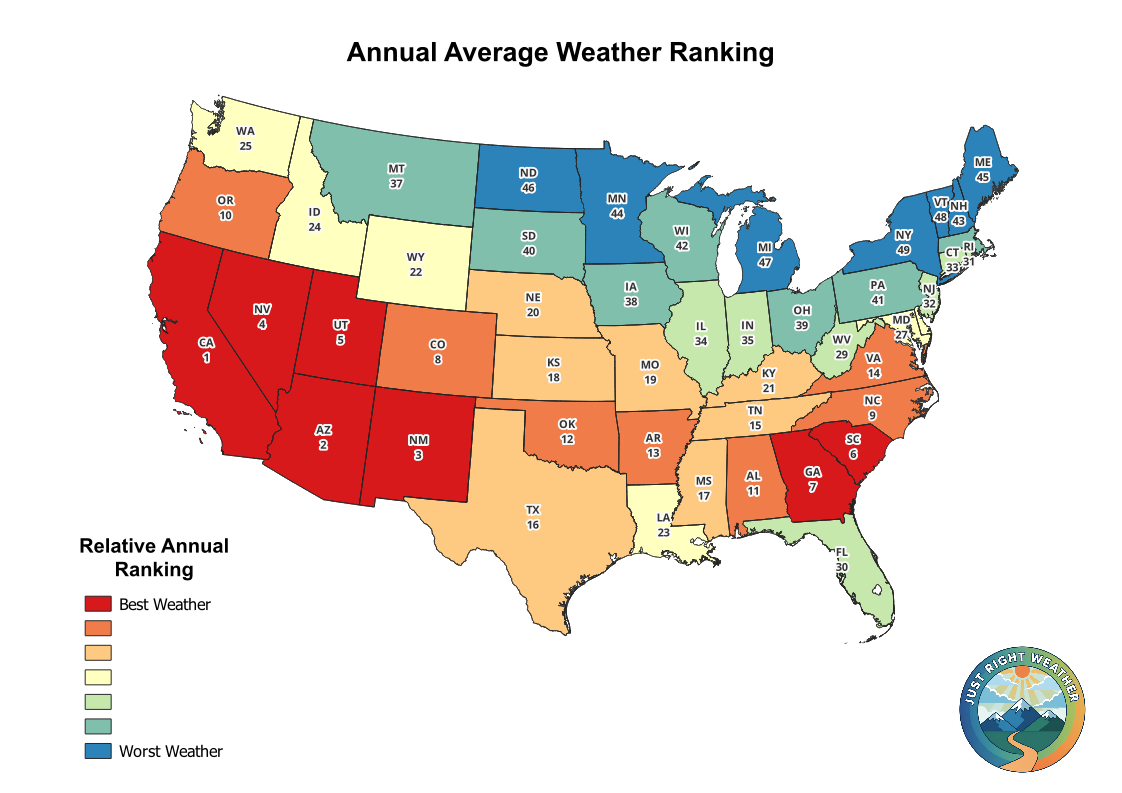
These rankings highlight which states had the best overall weather patterns in 2025 based on forecast-derived Perfect Weather Index scores. They are not climate normals, relocation guarantees, or official forecasts.
How State Rankings Are Calculated
The ranking is designed for broad comparison. It summarizes many local forecast points into a statewide score, so states with diverse terrain may include both excellent and poor weather areas at the same time.
States With the Most Consistently Favorable Weather
Based on statewide average weather scores, these states tend to rank well across multiple seasons.
- California
- Arizona
- New Mexico
- Nevada
- Utah
The Southwest often performs well because of abundant sunshine and generally lower humidity, even though extreme summer heat can occur. Because rankings are statewide averages, higher-elevation and coastal regions can help balance hotter seasonal periods.
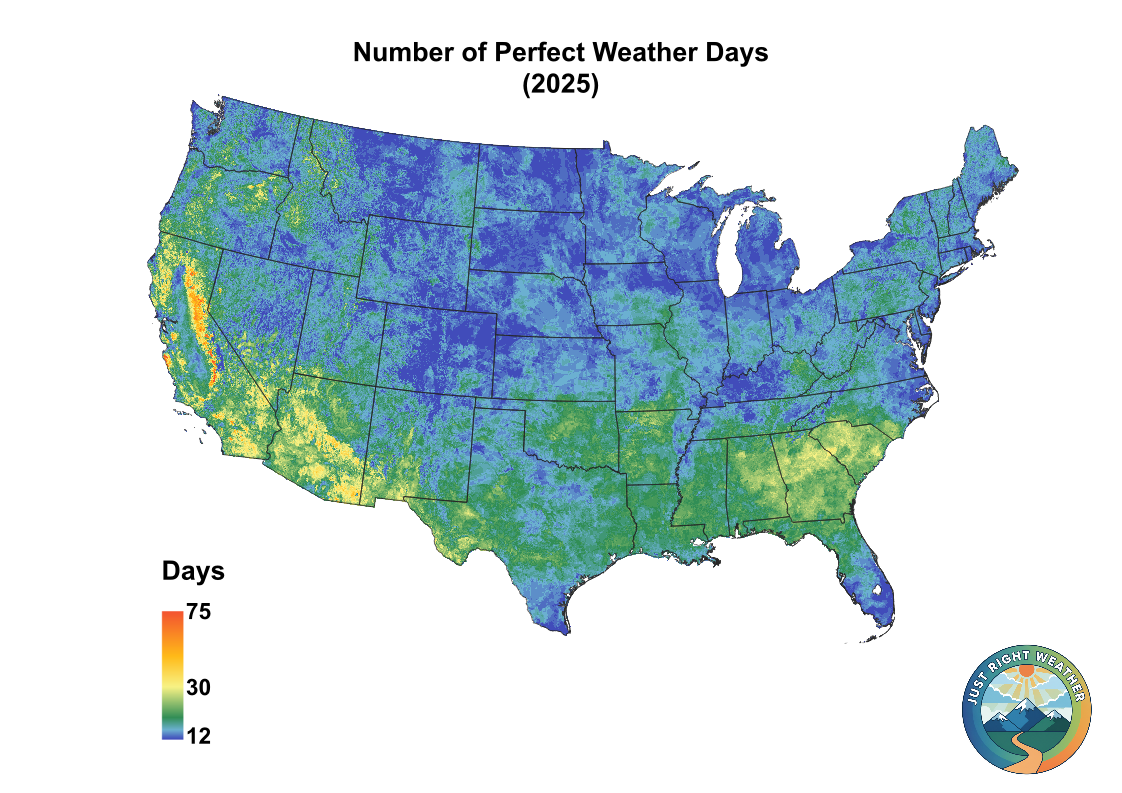
Best Weather Shifts Throughout the Year
Rather than one state dominating every month, the best weather shifts by season. Some states rank highly during part of the year and lower during another.
Winter
- Arizona
- Southern California
- Texas
- New Mexico
Spring
- California
- North Carolina
- Tennessee
- Arkansas
Summer
- Colorado
- Washington
- Maine
- Montana
Fall
- New Mexico
- California
- North Carolina
- Virginia
How Geography Shapes State Weather Rankings
State rankings are strongly influenced by regional geography. Large states especially can include multiple weather regimes at the same time.
Important Data Note
State rankings are derived from forecast-based weather data and reflect relative patterns observed during 2025. Weather varies year to year, and results should not be interpreted as official climate normals or used for safety-critical decisions without consulting official forecasts.
Use these rankings for broad comparison, trip inspiration, seasonal context, and understanding geographic patterns. For day-to-day planning, use the current 7-day forecast pages and official local forecasts.
Explore More Weather Rankings
These pages provide more detailed views of how favorable weather changes by time period and location.
Weather Rankings Are Most Useful When They Show Patterns.
State rankings provide the broad view. Weekly, monthly, and activity-specific forecasts show how those patterns change when timing and purpose matter.
See This Week's Best Weather →