Olympic National Park is one of the most ecologically diverse parks in the U.S. — spanning temperate rainforest, rugged Pacific coastline, and glaciated alpine peaks — and one of the wettest. Timing your visit makes an enormous difference: July delivers 7 perfect weather days and an 86% PWI score, while winter months drop to 44–55% as storms roll in from the Pacific. Using Perfect Weather Index (PWI) scores calculated from daily National Weather Service forecast data, this page shows exactly when conditions are most comfortable across Olympic's dramatically varied landscapes.
Current Perfect Weather Index scores for the next 7 days at Olympic National Park. Higher scores indicate more comfortable outdoor conditions. Updated daily using National Weather Service forecast data.
| Loading… |
|---|
| Loading… |
How to use this: Days with higher scores are generally better for hiking and outdoor activities, with more comfortable temperatures, lighter winds, and fewer weather impacts. → View official National Weather Service forecast for Olympic
July is the best month to visit Olympic National Park by a significant margin — 86% PWI with 7 perfect days, the most of any month.
Based on Perfect Weather Index (PWI) data from the Olympic Peninsula — drawing on NWS forecast records and historical climate normals — the park shows a strongly seasonal Pacific Northwest pattern: a long wet winter and spring with frequent storms, a narrow but excellent summer window from mid-June through September, and a rapid return to wet conditions in October. Olympic receives some of the highest rainfall in the contiguous U.S. — the Hoh Rainforest averages 140 inches annually — making the dry summer window especially valuable. These seasonal patterns are consistent with long-term climate data for the Pacific Northwest coast.
Raw monthly totals were normalized into monthly PWI scores (percent of possible points) and paired with the number of rare Perfect 10 days.
Monthly PWI scores reflect the percentage of possible comfort points earned on the Olympic Peninsula across all days in each month, derived from National Weather Service forecast data and consistent with long-term climate normals for the region. Perfect 10 days are days scoring a full 10 out of 10 on the PWI scale.
| Month | Monthly PWI Score | Perfect 10 Days | What It Means | Verdict |
|---|---|---|---|---|
| January | ~55% | 0 | Cold, snowy, limited access | Avoid |
| February | ~46% | 0 | Wet, cloudy, lowest comfort | Avoid |
| March | ~44% | 0 | Winter lingers, stormy | Avoid |
| April | ~63% | 0 | Improving but variable | Caution |
| May | ~64% | 0 | Cool, gradually stabilizing | Caution |
| June | ~76% | 2 | Strong early summer window | Very Good |
| July ⭐ | ~86% | 7 | Peak reliability and comfort | Excellent |
| August | ~81% | 3 | Warm, dry, very stable | Excellent |
| September | ~80% | 3 | Crisp, excellent visibility | Excellent |
| October | ~60% | 0 | Rapid shift to wetter pattern | Caution |
| November | ~51% | 0 | Storm season returns | Avoid |
| December | ~46% | 0 | Cold, snowy conditions | Avoid |
PWI scores based on NWS forecast data for the Olympic Peninsula. The Hoh Rainforest and west-side coastal areas receive significantly more precipitation year-round than the Port Angeles / Hurricane Ridge area.
Average monthly visitor counts at Olympic National Park (2019–2023 average, source: NPS). August draws the most visitors but July offers the highest PWI score — and September delivers strong conditions with noticeably fewer visitors than peak summer.
| Month | % of Annual Visitors | Avg Visitors | Crowd Level |
|---|---|---|---|
| January | 3% | 100,710 | Low |
| February | 3% | 117,866 | Low |
| March | 4% | 166,801 | Low |
| April | 6% | 216,512 | Moderate |
| May | 9% | 320,846 | Moderate |
| June | 10% | 377,950 | High |
| July ⭐ | 15% | 569,479 | Peak |
| August | 17% | 615,644 | Peak |
| September | 14% | 537,342 | High |
| October | 9% | 339,243 | Moderate |
| November | 6% | 235,137 | Moderate |
| December | 3% | 119,737 | Low |
Source: National Park Service visitor use statistics, 2019–2023 average.
July is Olympic's standout month — 86% PWI with 7 perfect days, the most of any month. The Pacific storm track shifts northward, bringing the Olympic Peninsula its characteristic summer dry period. Skies clear dramatically compared to spring and fall, temperatures are warm but not hot, and the park's extraordinary diversity of landscapes — from rainforest to alpine meadows to wild coast — is fully accessible. July is the single best month to experience Olympic at its most comfortable.
August scores 81% PWI with 3 perfect days — still excellent conditions as the summer dry period continues. August draws more visitors than July (17% vs 15% of annual total) but the weather remains very strong. Hurricane Ridge is fully accessible, the Hoh Rainforest trails are at their most comfortable, and the Pacific coastline delivers long clear days with dramatic sunset light.
September scores 80% PWI with 3 perfect days — nearly identical to August but with noticeably fewer visitors as summer travel winds down. The first hints of fall appear in higher elevations, morning fog along the coast creates atmospheric conditions, and the park feels considerably less crowded than peak summer. September is the best month for visitors who want excellent weather without the crowds of August.
June scored 76% PWI with 2 perfect days — a solid early summer month as the dry season establishes itself. Early June can still see significant cloud cover and occasional rain, particularly on the west side of the peninsula. By late June conditions improve markedly. Visitor numbers are lower than peak summer, making June a good option for those who don't mind slightly more variable weather.
October sees a sharp drop to 60% PWI as Pacific storms return. Early October can still offer comfortable days but the wet season typically reasserts itself by mid-month. Fall color appears at Hurricane Ridge and in the rainforest, making early October scenic despite the changing conditions. Visitor numbers drop significantly from summer peaks.
Winter and spring at Olympic are defined by Pacific moisture — heavy rainfall at lower elevations, deep snowpack at Hurricane Ridge, and persistent cloud cover. PWI scores drop to the 44–64% range from November through May. The Hoh Rainforest is genuinely dramatic in winter with its moss-draped trees and rushing rivers, and Hurricane Ridge offers exceptional snowshoeing and skiing — but casual summer-style hiking is very limited. March is the lowest-scoring month at 44% PWI.
Olympic is unique among U.S. national parks in encompassing three entirely distinct ecosystems within one boundary. Weather across these three zones varies significantly — the PWI scores on this page reflect general Olympic Peninsula conditions, but your experience will depend heavily on which part of the park you visit.
The Olympic rain shadow creates a dramatic weather divide across the peninsula. The west side (Hoh, Quinault, coast) receives 100–140 inches of rain annually while the east side (Port Angeles, Hurricane Ridge) receives just 25–30 inches. In summer this difference largely disappears as the whole peninsula dries out — but in spring and fall, the east side often has better conditions than the west.
What is the best time to visit Olympic National Park?
July is the clear best month — 86% PWI with 7 perfect days and the full park accessible. August and September are nearly as good and offer slightly fewer crowds. The window from mid-June through September is the reliable summer dry season; outside of it, expect frequent rain, particularly on the west side of the peninsula. If you're visiting specifically for the Hoh Rainforest or coastal beaches, the park is accessible year-round — but July through September will give you the best weather for any activity.
How much does it rain at Olympic National Park?
It depends dramatically on where in the park you are. The Hoh Rainforest on the west side averages around 140 inches of rain annually — one of the highest totals in the contiguous U.S. The east side near Port Angeles averages just 25–30 inches, comparable to many inland cities. The Pacific coast falls somewhere in between. In summer (July–September), the entire peninsula dries out significantly and the west-east difference shrinks. From October through May, the west side can see weeks of near-continuous rain while the east side has notably better conditions.
Is Hurricane Ridge worth visiting?
Yes — Hurricane Ridge is one of the most accessible alpine experiences in any national park, sitting at 5,242 feet with panoramic views of the Olympic Mountains and, on clear days, Vancouver Island and the Strait of Juan de Fuca. The road from Port Angeles is 17 miles and typically takes about 45 minutes. In summer it's open daily; in winter it opens on weekends for snowshoeing and skiing when conditions allow. July and August deliver the most reliable clear days at the summit. Go early in the morning before afternoon clouds build.
When is the best time to visit the Hoh Rainforest?
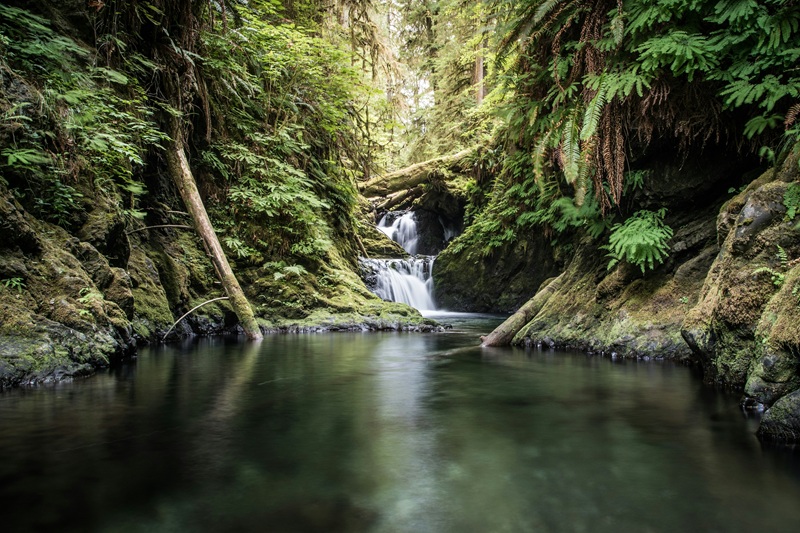
The Hoh Rainforest is spectacular in every season but most comfortable from July through September when rain is least frequent. Winter and spring visits offer a more dramatic, moody atmosphere — the mosses and ferns are at their most vivid after rain, rivers run full, and there are virtually no other visitors — but you should expect wet conditions. The Hall of Mosses trail is only about a mile and accessible year-round. The longer Hoh River Trail to the glacier is best tackled in summer when water levels allow safe river crossings.
What is the best time to visit Olympic for international visitors?
July is the clear first choice — the only month that reliably delivers the full Olympic experience across rainforest, mountains, and coast simultaneously. August and September are excellent alternatives. Olympic is easily reached from Seattle (about 3 hours by car and ferry, or 2.5 hours via the Hood Canal Bridge) and pairs naturally with Mount Rainier National Park and the North Cascades for a comprehensive Pacific Northwest trip. Seattle-Tacoma International Airport is the primary gateway with strong international connections.
What is the Perfect Weather Index?
The Perfect Weather Index (PWI) is a daily comfort score from 1–10 calculated from National Weather Service forecast data. It combines temperature, sunshine, humidity, wind, and precipitation into a single rating. A score of 8 or higher means genuinely excellent outdoor conditions. Scores below 4 reflect cold, storms, or other conditions that significantly limit outdoor comfort. Learn more about how the PWI works →